
OEE
What is OEE? Why is it financially important? How to calcultate OEE? How to use it for continuous improvement?
1. What is OEE?
OEE or Overall Equipment Effectiveness is the gold standard metric for measuring productivity in manufacturing and service processes. It is based on one piece of equipment in the line/cell or step value adding process. It focuses on three components:
OEE = Quality x Availability x Performance
This metric helps us understand how efficient a production process is on a range from 0% to 100%. A world class company performs at 85% OEE or above. OEE median varies depending on the industry but it follows a normal distribution with most companies being at 50%-60% OEE (See graph below).
The difference between world class performers (85% OEE) and average companies (50%-60%) is 35% - 25%. This is called the hidden factory. It is already in place but can only be accessed by motivated teams, having the right systems for identifying, pursuing and sustaining it. The road from 50%-60% to 75%-80% OEE is fairly straight forward and most companies achieve it in a couple of years. The push from 80% to 90% takes a little more effort.
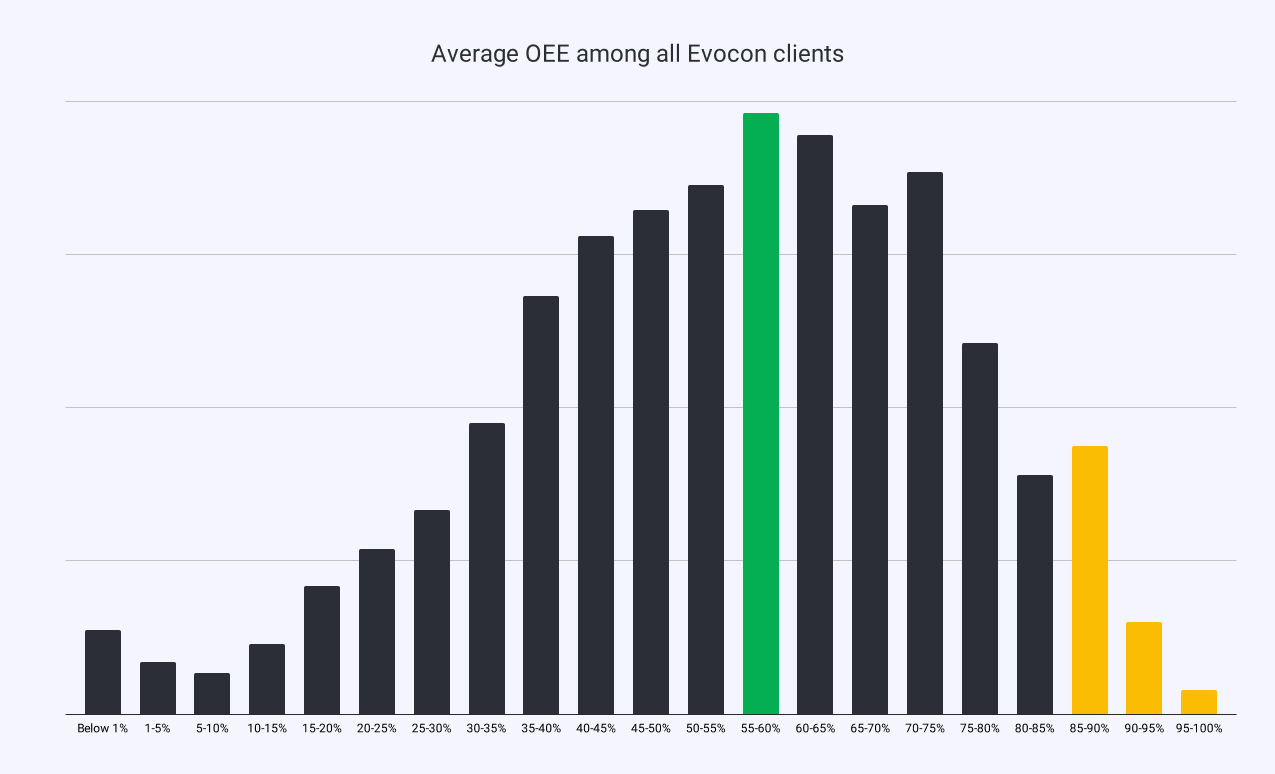 Source: Evocon
A more detailed industry specific average of OEE can be seen in the graph below:
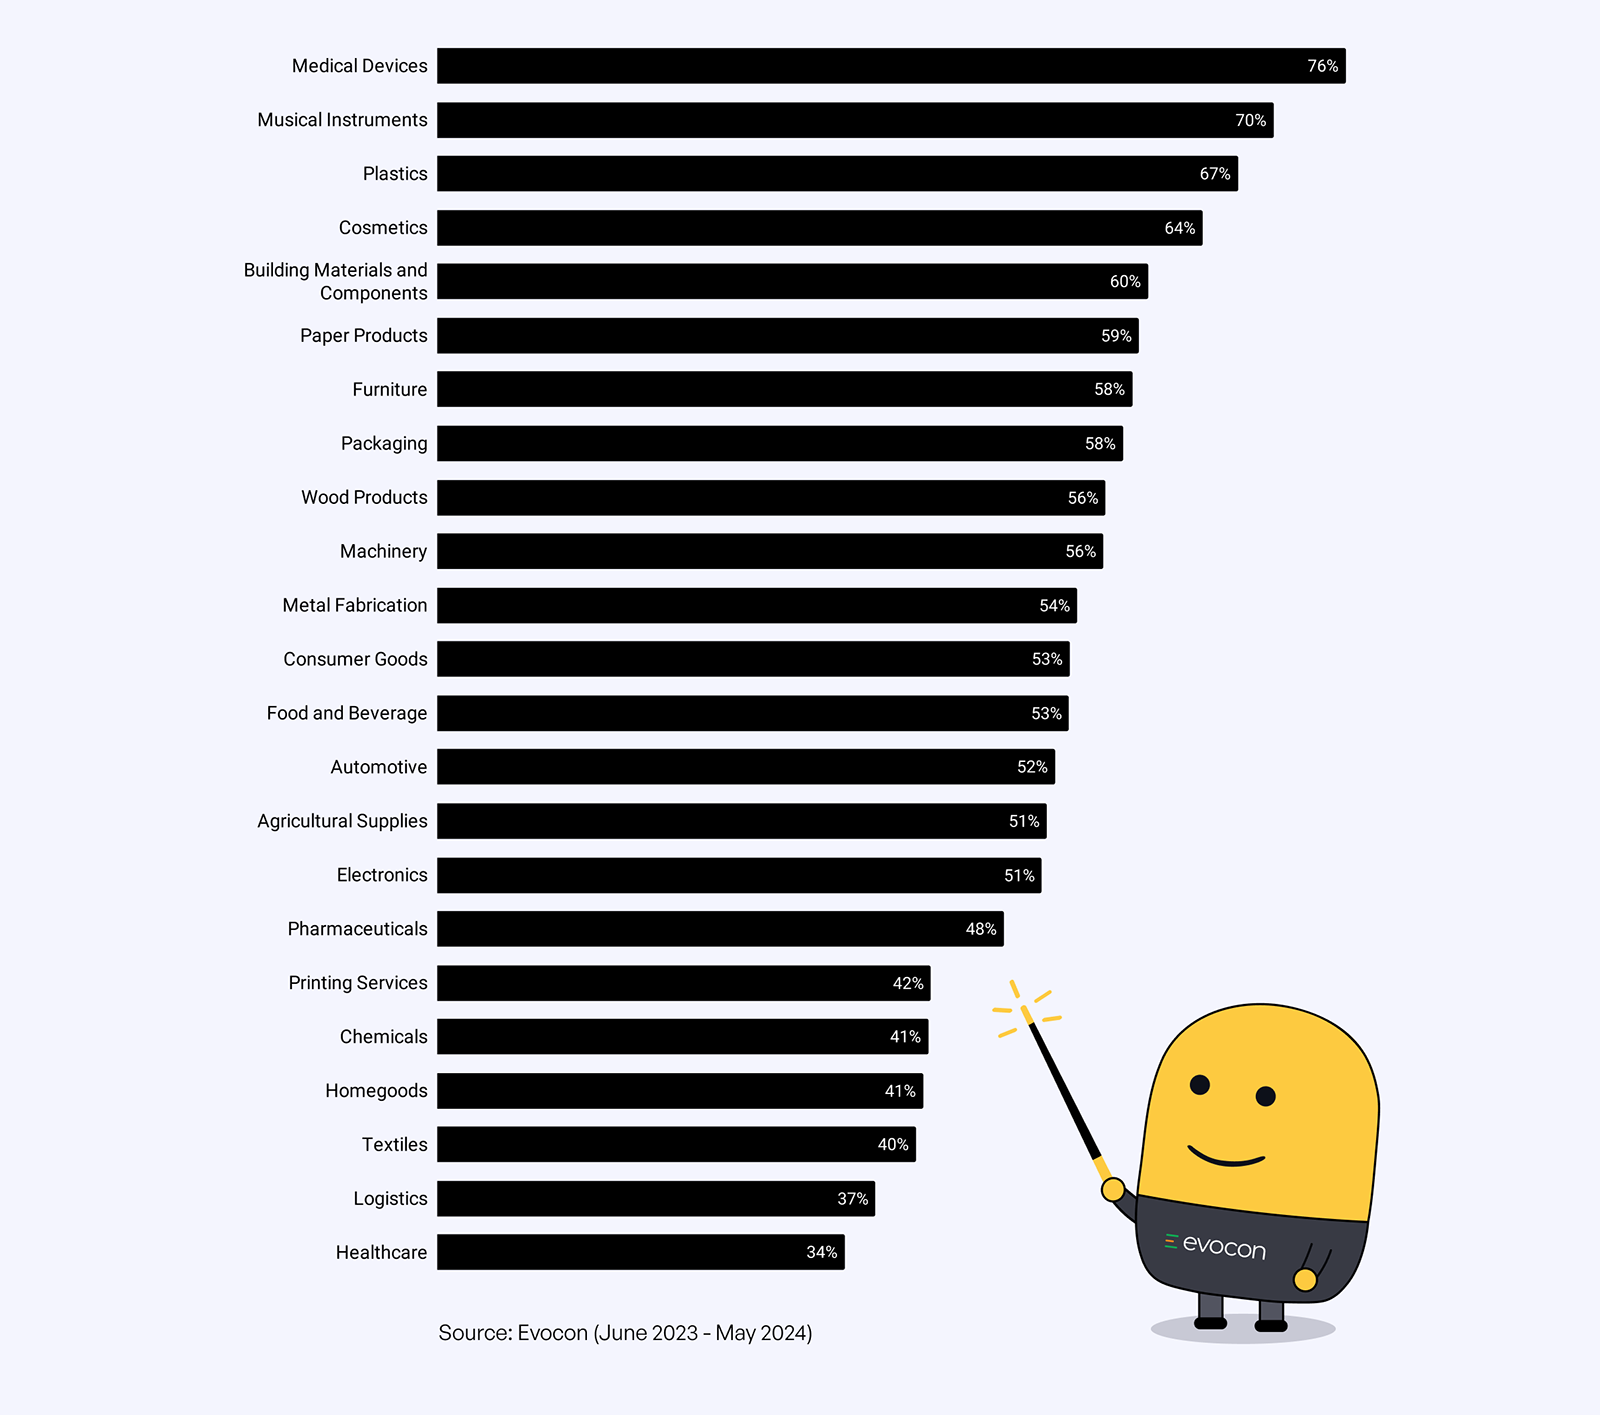 Source: Evocon
2. Why is OEE financially important?
Let’s take Company X in the Food and Beverage Industry that has a product line with 53% OEE. It has:
- 20 employees on 1 shift
- $21/h average pay per employee (including fringe benefits)
- 22 working days/month and 12 months/year
Labor cost: $887,000/year = 20 empl x $21/h x 8h/day x 22 days/month x 12 months/year
By improving to 75% OEE the company can:
- Save $260,000/year in labor by moving employees to other areas
- Sell up to 40% more product and produce it with the same costs ($887,000/year)
OR
The example above is a real world project. A combination of reallocating people to other lines and increasing sales yielded a $369,000 return with a $60,000 investment broken down as follows:
- $15,000 new piece of equipment
- $20,000 equipment upgrade
- $25,000 training
3. How to calculate OEE?
OEE = Availability x Performance x Quality
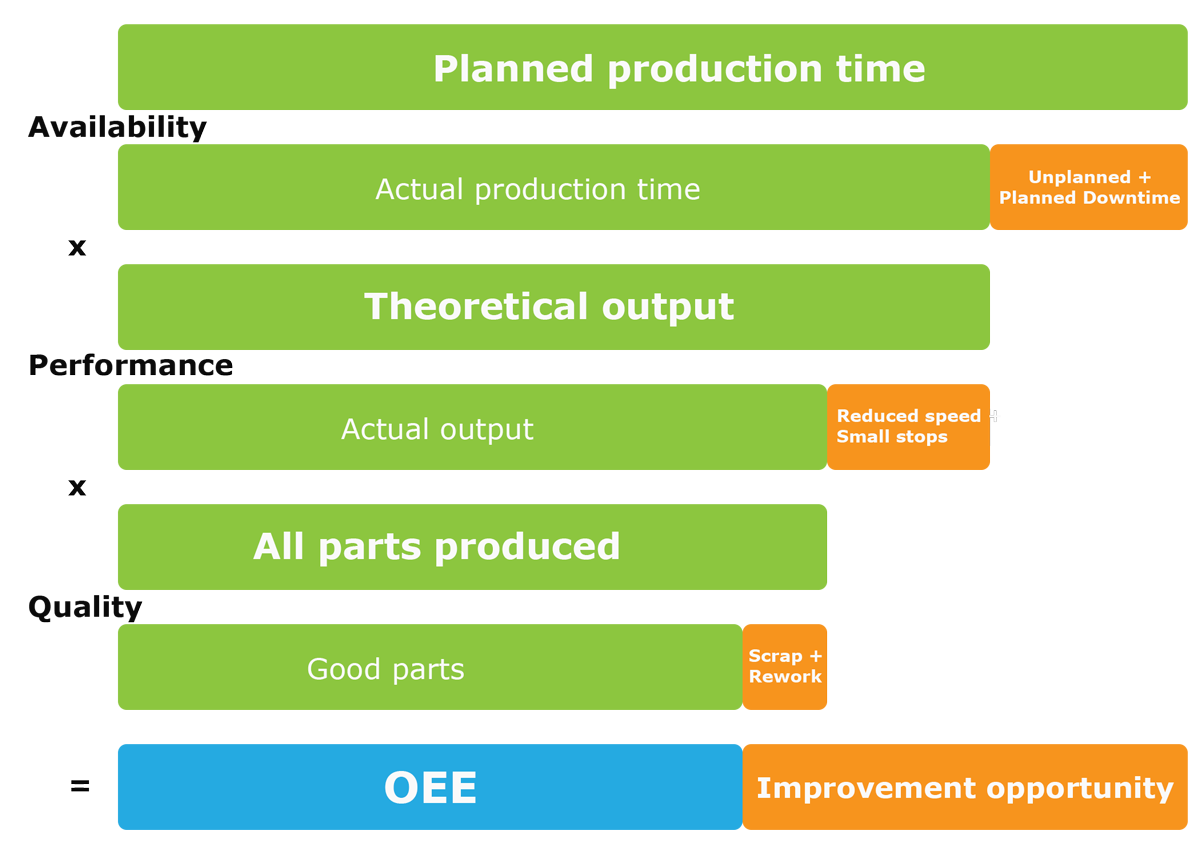
The 6 big loses in manufacturing:
- Planned downtime - Setup, changeover, luches/breaks, planned maintenance etc.
- Unplanned downtime - Equipment breakdown, lack of material, power outage
- Speed loss - Running equipment at lower speeds than maximum due to malfunction, not enough staffing, substandard material
- Minor stops - Jammed material, sensor issues, incorrect speed settings,
- Rework - Parts that need more processing than normal to pass quality = additional deburring, trimming, touching up
- Scrap - The whole piece is remelted, sent to the recycler or thrown in the trash
Example: To illustrate the calculation of OEE we will use a packaging line with an ideal speed of 30 bags/min.
Availability:
- Planned production – 8h
- Line setup – 45 min (0.75h)
- Lunch + 2 breaks – 1h
- Downtime (conveyor motor burned) – 30 min (0.5h)
- Actual run time = 8h – 0.75h – 1h – 0.5h = 5.75h
Availability % = (Actual run time / Planned run time) x 100 = (5.75h / 8h) x 100 ≈ 72%
Performance:
- Theoretical output: 5.75h x 60 min/h x 30 bags/min = 10,350 bags.
- Actual output (from the counter on packaging equipment): 8,625 bags.
Perfomance % = (Actual output / Theoretical output) x 100 = (8,625 / 10,350) * 100 ≈ 83%
Quality:
- Total bags produced – 8,625 bags.
- Bags rejected throughout the shift for being underweight – 450 bags.
- Good bags (that can be sold) – 8,625 – 450 = 8,175 bags.
Quality % = (8,175 / 8,625) x 100 ≈ 95%
OEE = Availability x Performance x Quality = 72% x 83% x 95%= 57%
4. How to improve using OEE?
Once we see the numbers they lead to questions regarding our line efficiency. The issues are being addressed in the order of their magnitude (Pareto). We see that Availability is only 72%, so we could ask the following questions:
- Can we schedule lunches and breaks with coverage so that the line keeps running?
- Can we reduce the setup time(SMED)?
- What is the root cause (5Why, PDCA, A3) of the motor burning out?
Performance was at 83% so we might want to get a better understanding of what lead to it. Depending on the floor management system in place there are different approaches to problem solving this short term and long term.
Counter measures put in place:
- motor issues were a daily occurrence (0.5h/day reduction) - solved
- covering the breaks (0.5h/day reduction) with scheduling
- reducing the setup time by 15 min/day (0.25h reduction)
The new OEE was as follows:
Availability:
- Planned production – 8h
- Line setup – 30 min (0.5h)
- Lunch – 0.5h
- Downtime (conveyor motor burned) – solved
- Actual run time = 8h – 0.5h – 0.5h = 7h - 1.25h more production time
Availability % = (Actual run time / Planned run time) x 100 = (7h / 8h) x 100 ≈ 87.5%
Performance:
- Theoretical output 7h x 60 min/h x 30 bags/min = 12,600 bags.
- Actual output 10,500 bags – 1,875 more bags ≈ 22% output increase
Perfomance % = (Actual output / Theoretical output) x 100 = (12,600 / 10,500) * 100 ≈ 83%
Quality:
- Total bags produced – 10,500 bags.
- Bags rejected throughout the shift for being underweight – 525 bags. – slight increase of rejects but the percentage is constant
- Good bags (that can be sold) – 10,500 - 525 = 9,975 bags.
Quality % = (9,975 / 10,500) x 100 ≈ 95%
New OEE = Availability x Performance x Quality = 87.5% x 83% x 95% = 69%
We just unlocked a part of the hidden fatory and increased output by 22% or 1,800 bags/day by collaborating on making the problems visible and contributing to problem solving and implementation.
Time to celebrate and reward participants.
